The amount of traces depends on the sampling rate of the OTEL instrumentation in the router.
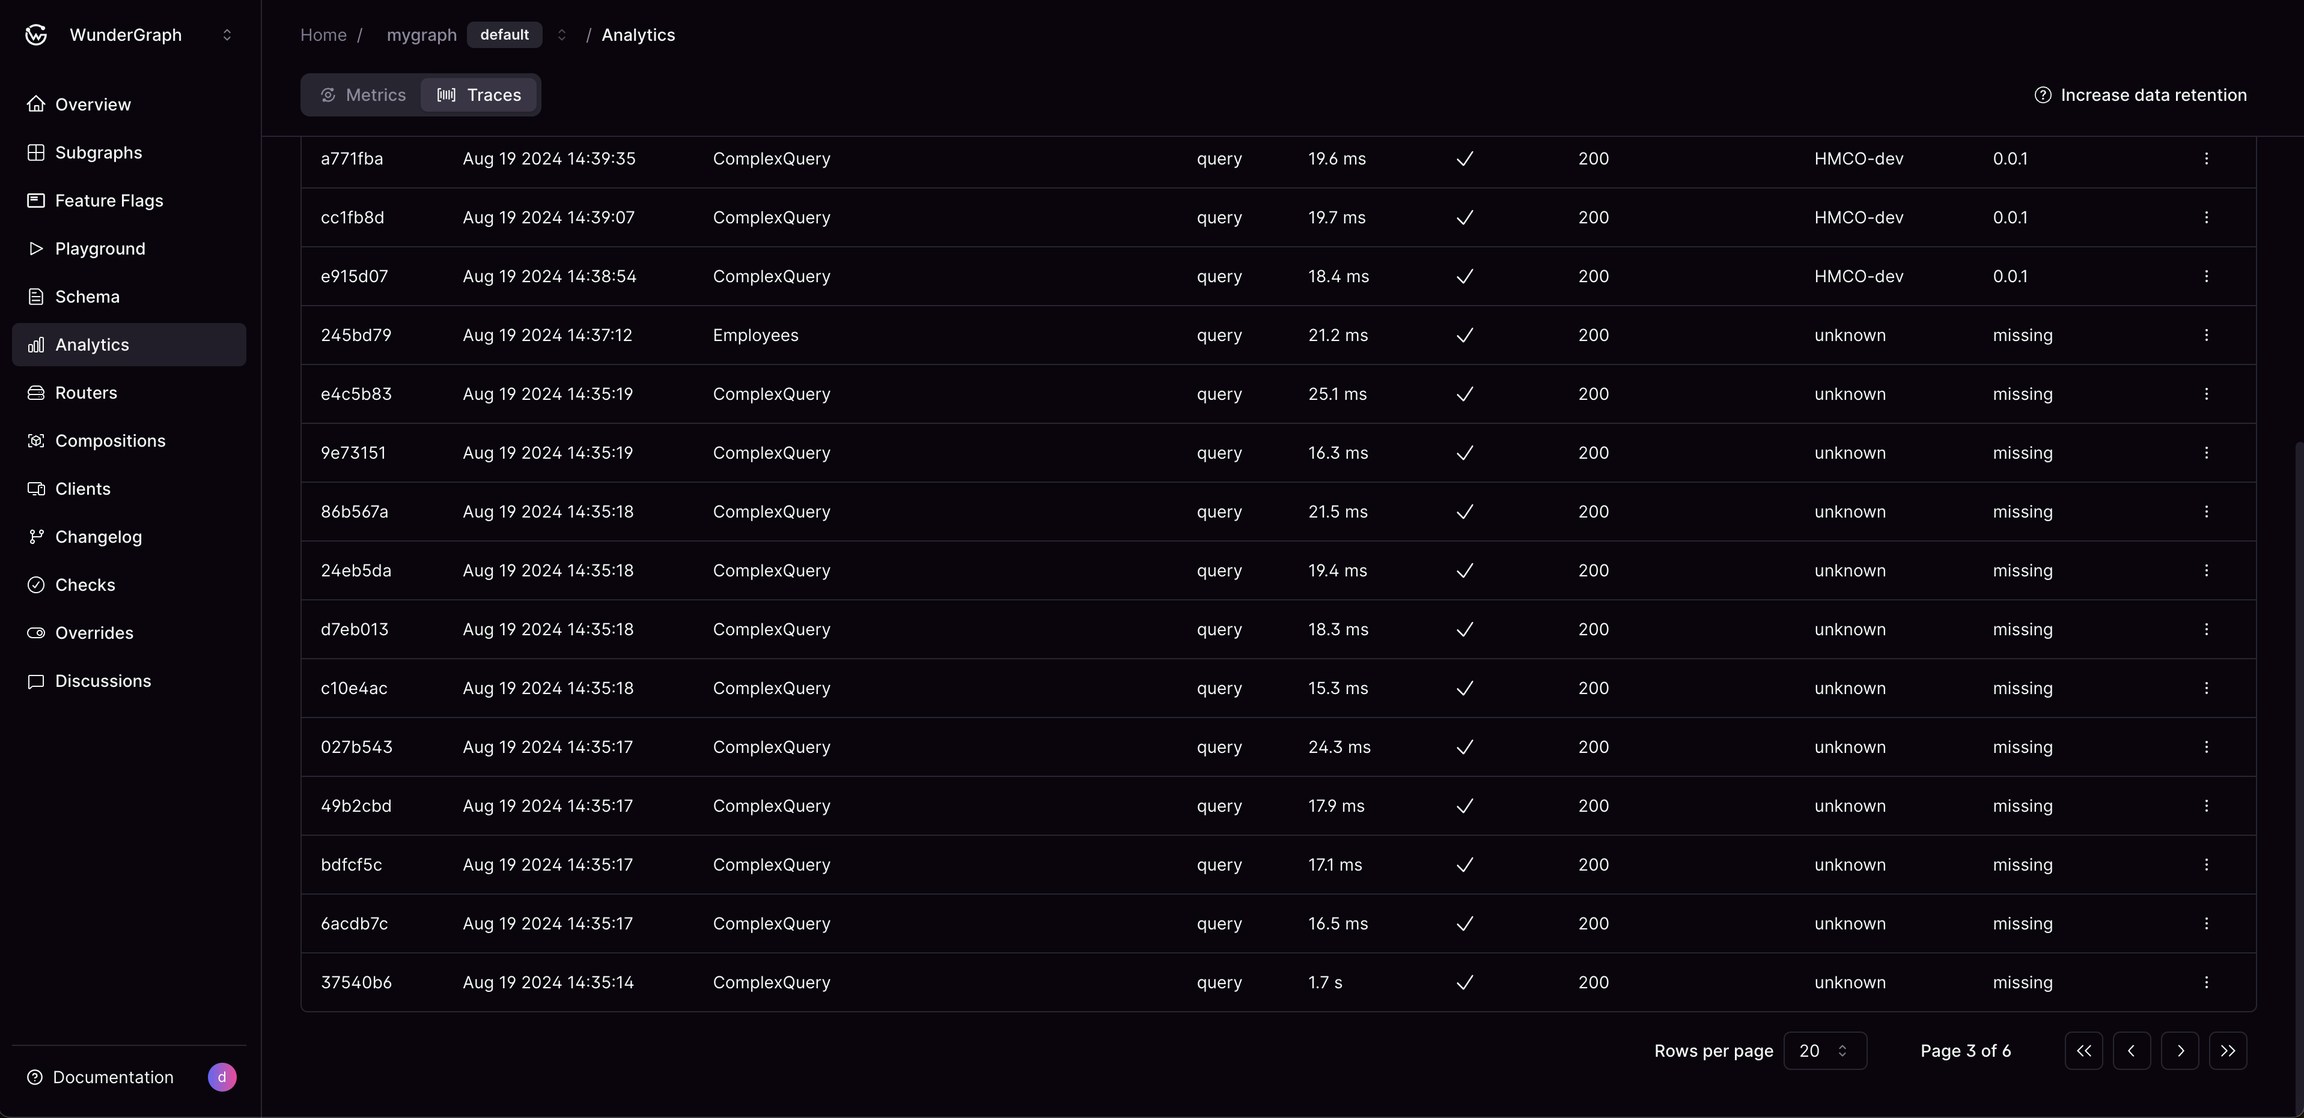
WunderGraph Cosmo Analytics: Traces overview
Date Range
The date range filter lets you narrow down the list of requests based on when they were made. You can select one of the pre-defined ranges or select a custom date and time.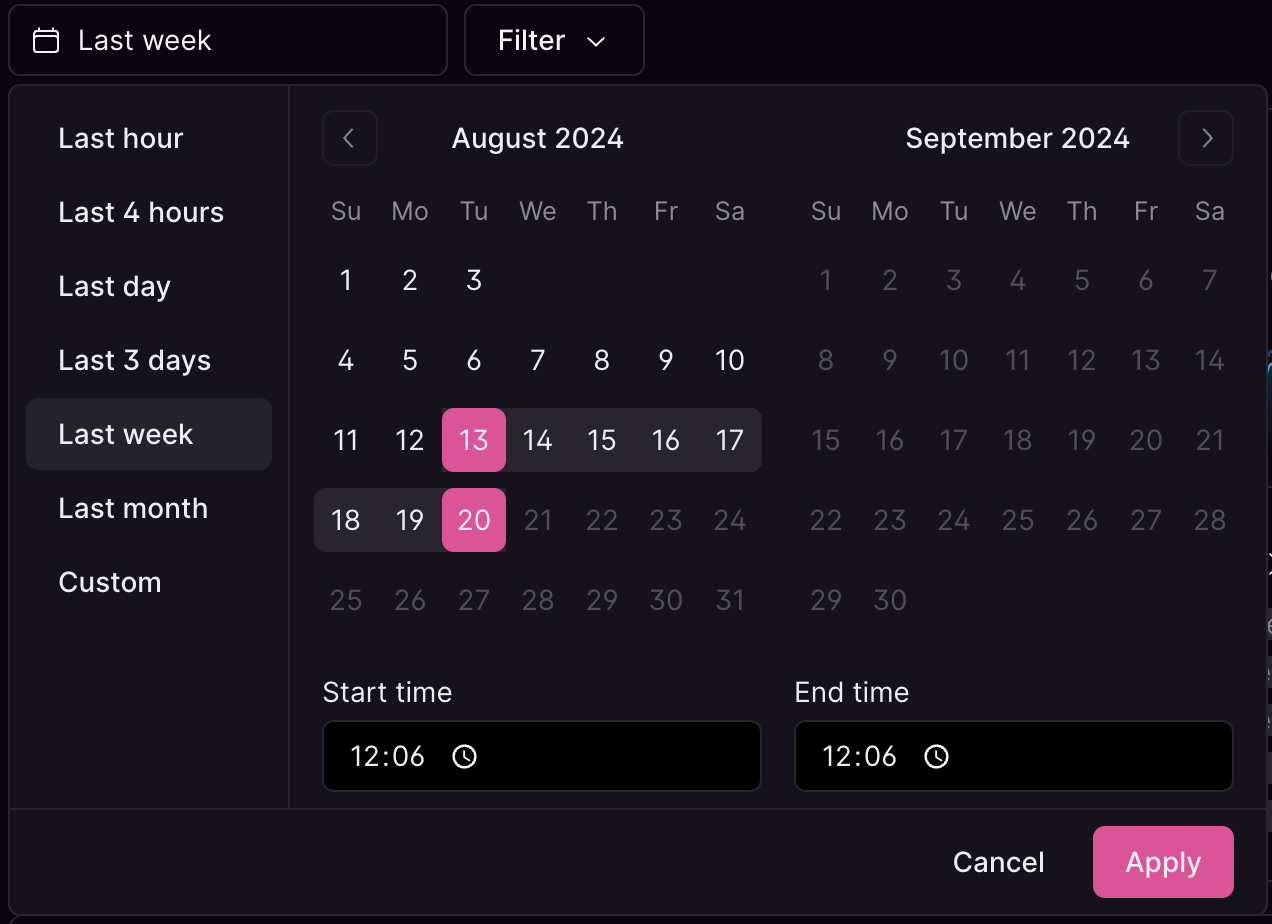
Date range selector
Filters
Filters allow you to narrow down to specific requests and are a powerful tool to find and debug GraphQL requests. The available filters can be different depending on the selected date range or grouping field.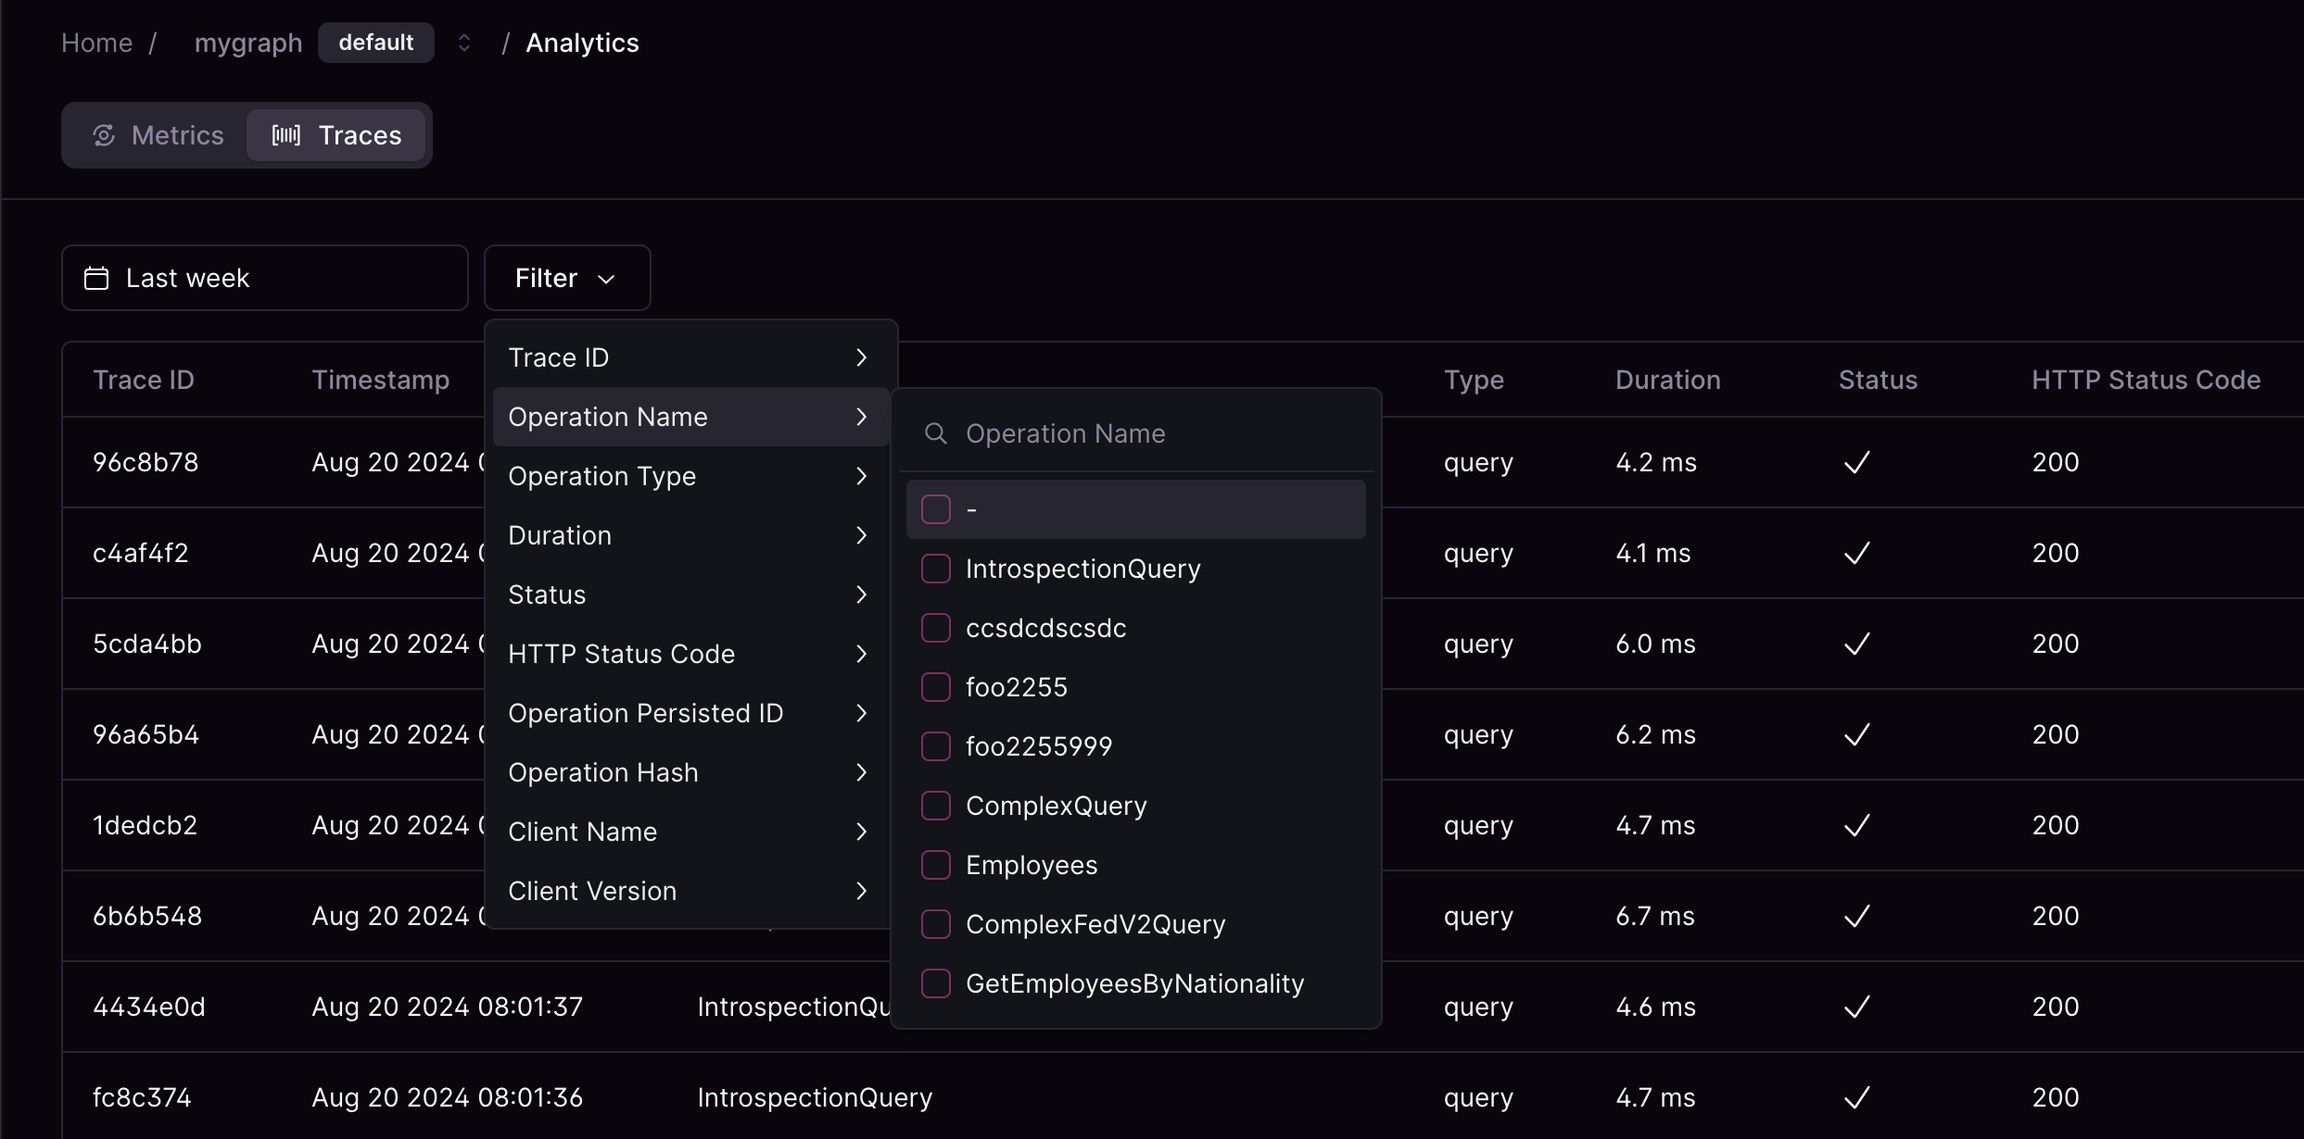
Selecting an Analytics: Traces filter
Grouping
The grouping feature allows you to group the data in the table by none, operation name, client, or error message.- None: The default view with no grouping applied. Each row represents an individual request made to the federated graph.
-
Operation Name: Grouping by operation name will cluster the requests based on the operation type that was executed.
- Client: Grouping by client allows you to see all the requests made by a particular client and client version. These are read from the headers
graphql-client-nameandgraphql-client-versionthat you can set on your client application.
- Client: Grouping by client allows you to see all the requests made by a particular client and client version. These are read from the headers
- Error Message: Grouping by error message clusters all requests that resulted in the same error message. This grouping can be particularly useful for identifying and diagnosing common errors.
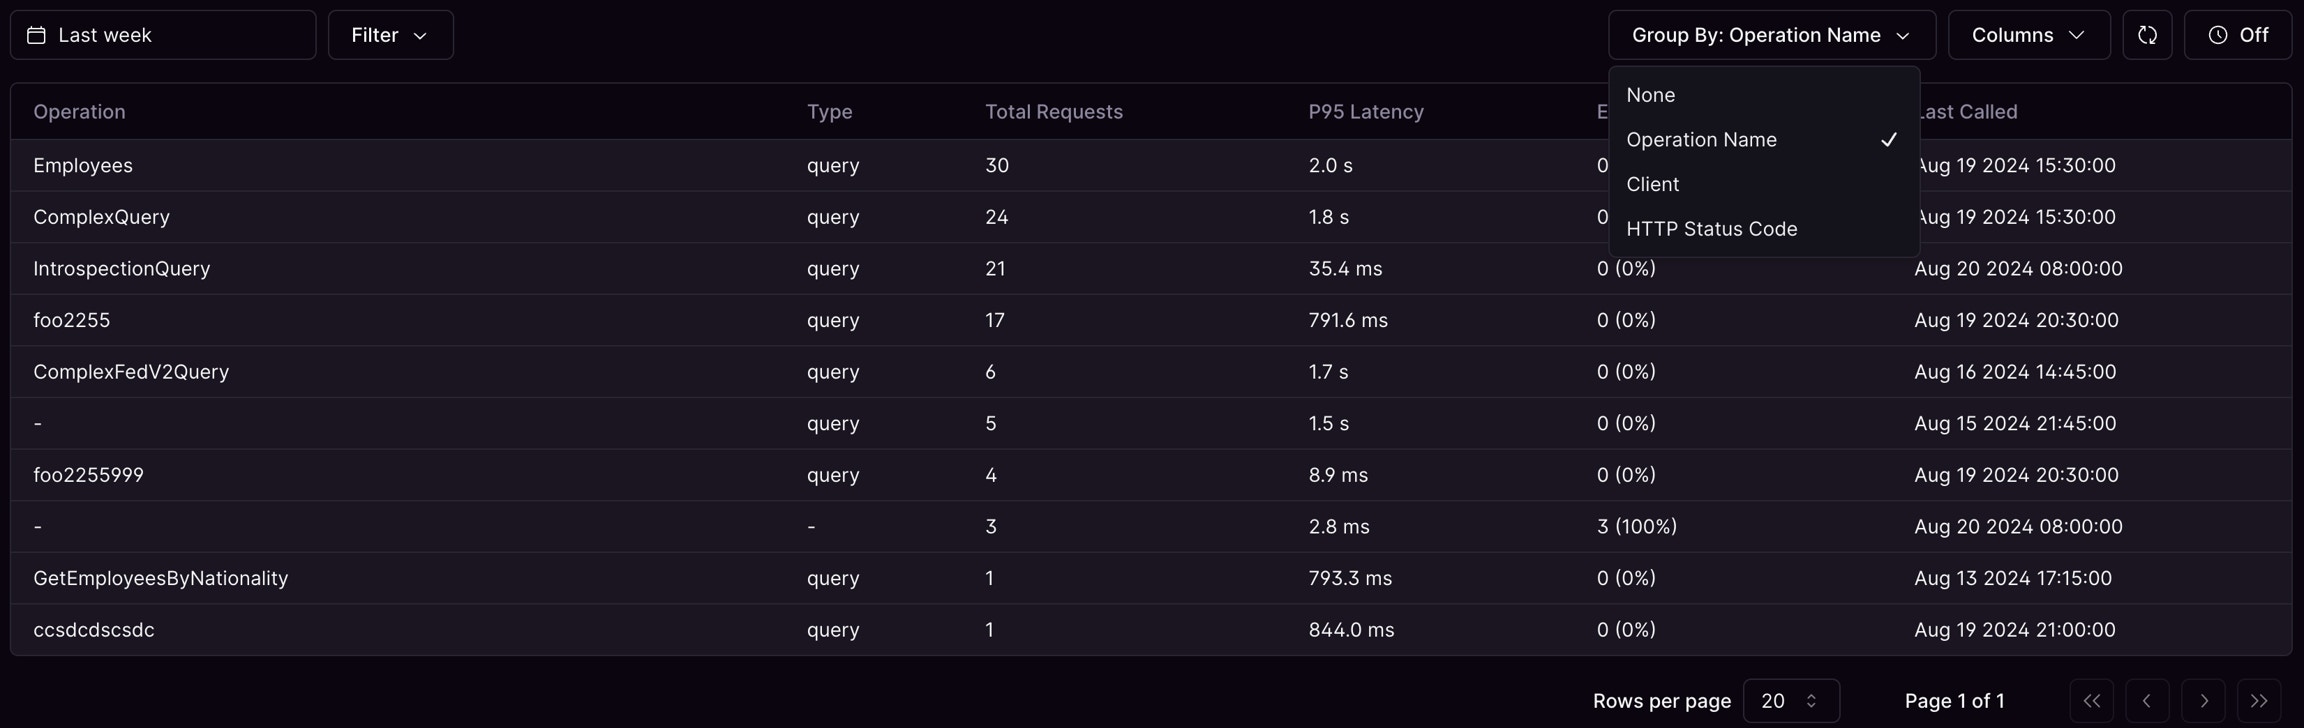
Analytics: Traces "Group By" menu
Auto-refresh
The table supports auto refreshing though selected intervals of 10 seconds, 30 seconds, 1 minute and 5 minutes.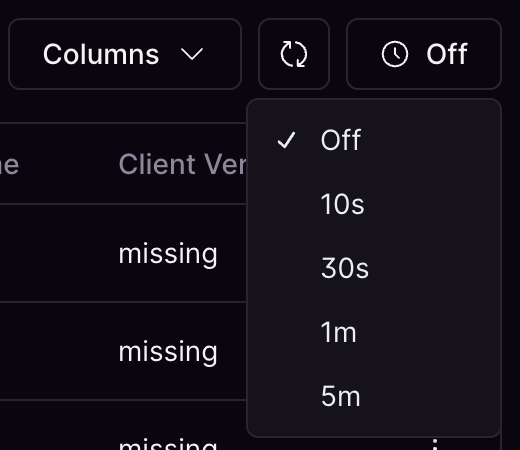
The Analytics auto-refresh menu